
Half the battle of digital marketing is not only creating and implementing a strategy but evaluating your online performance. For schools, that means understanding how well your website is attracting prospective students and converting them into applicants. With Google Analytics for higher education, schools can gain valuable insights to better shape their digital marketing strategy.
Google Analytics is an extremely valuable platform for schools looking to monitor the behaviour of their target audience through website traffic. It is one of the key ways your school can measure success at each stage of the enrollment funnel. And now, this platform is getting ready to offer new and improved features with its latest version: Google Analytics 4. Google Analytics 4 (GA4) comes into effect as of July 2023, and all new analytics properties will default to the new version.
What does this mean for your school? The switch to GA4 will affect everyone using Universal Analytics (UA), the current version of Google Analytics. If you’re wondering when to make this move, now’s the time to start!
Here’s a look at some of the key changes to expect with GA4 and how the transition can boost your school’s digital marketing efforts.

Universal Analytics vs GA4: What’s the Difference?
Since 2012, education marketers have been using Google Analytics to measure and optimize the experience on their school’s website. Want to understand who’s visiting your website, on which pages, and for how long? That’s what GA does in addition to measuring what actions students take on your website, where they come from, and what drives them to your organization. These are all key to understanding and improving your enrollment results.
However, since the birth of Google Analytics, many things about the digital landscape have changed–from device usage to privacy regulations and big data. GA4 aims to meet the evolving trends of the digital space by developing a more streamlined and accurate data system.
By changing how it measures, collects, and reports data, the new platform will ultimately change how your school reports on analytics. With scalable, custom metrics, your school can choose what it wants to see and gain real insight into how effectively prospects are engaging with your campaign.
But when it comes to Google Analytics for education, UA will stop collecting and processing data on your school’s website traffic. As of July 22, 2023, your school won’t be able to access old data on website traffic and other metrics; your school will lose visibility on the actions taken by prospective students on your website. This kind of data is important for your school to compare how it is performing from year to year. By getting on board with GA4 sooner rather than later, you can prepare for this transition by accumulating a bank of historical data for when the new version comes into effect.
Improved Data Collection With New Google Analytics for Higher Education
When it comes to education marketing, your school should be concerned with the kind of data it’s collecting and where that data is coming from. What kind of content is earning clicks from prospects? Where are your leads coming from? Accurate data that answers these questions will help you to identify effective avenues for student recruitment and decide where to focus your school’s marketing efforts.
Track Prospects Across Multiple Channels and Devices
Google Analytics for education should focus on building a complete picture of a prospect’s journey with your school. With GA4, you can see which platforms, devices and content prospects are using to connect with your school.
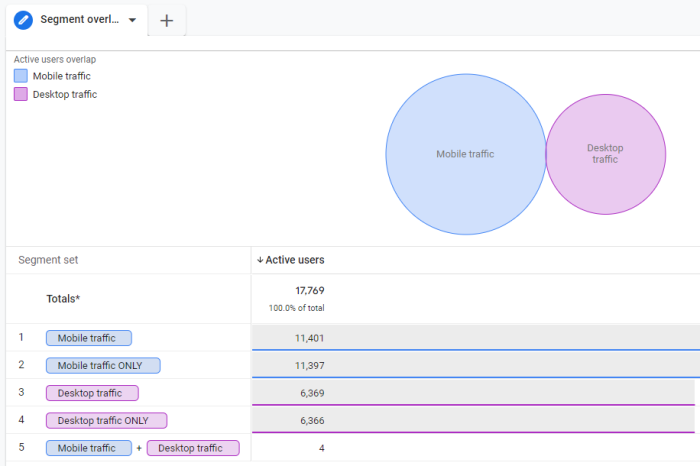
One of the most significant benefits of GA4 is that it accounts for the move away from desktop use to mobile use. Currently, over 59% of all internet traffic comes from mobile devices. Most prospective students will be switching between laptop browsers, mobile apps, and tablets to research and engage with schools. GA4 allows your school to unify data collected from multiple devices for a more accurate impression of user behaviour.
In the image below, you can see how the data report creates segments for mobile traffic, desktop traffic, and combined traffic. In this report, cross-device tracking identified 4 people who entered the website through different devices. With this kind of data, marketers can make a strong case for prioritizing and optimizing mobile content.
Along with cross-device tracking, HEM’s Director of Paid Ads and Analytics, Alexander Nachaj, highlighted how GA4 offers more robust e-commerce and transactional tracking for schools that use self-service checkouts for course registration and sign-ups. An increasing number of educational institutions rely on various ecommerce platforms to offer their students self-service registration options. Accurately tracking these course purchases is essential for any school seeking to understand which markets and channels their students are using. “This is often the case for big universities or online universities,” noted Alexander.
Event-Based Data Model Vs. Page View Model
With a model that compiles data from different sources, any interaction on the web will now be labelled as an “Event.” While Universal Analytics tracks each action on a page and records them as individual “Hits,” GA4 doesn’t distinguish. Whether a prospect views a page on your school’s website, downloads a brochure, or registers for your next open day–these are all classified as Events in GA4.
The example below shows some of the actions that a prospective student might take on your school’s website and the difference in how UA and GA4 track these interactions.
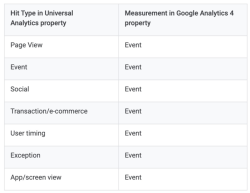
Source: Google
What we’re seeing is a more holistic data model with a wider scope. By accounting for all web interactions across different devices, GA4 will help your school build a more complete understanding of a prospect’s journey–where they are coming from and what actions they are taking along the enrollment funnel. Ultimately, it’s this information that will help you adapt your marketing strategy to the behaviour of applicants today and deliver a future-friendly analytics experience that focuses on the user.
Customize Your School’s Data Reports in Google Analytics for Higher Education
GA4 not only offers better access to metrics, but you can also choose what you want to analyze. With a new level of customization, your school can build and organize reports to identify specific insights about your audience. You’ll be able to see each of the steps that prospective students are taking as they move closer to becoming applicants.
To get started on the new Google Analytics for higher education, you will want to check out the list of built-in templates for ways to visualize and organize your school’s data. In the example below, you can see the different data templates that are available on GA4. Different templates can be used to target different insights on your prospective students.
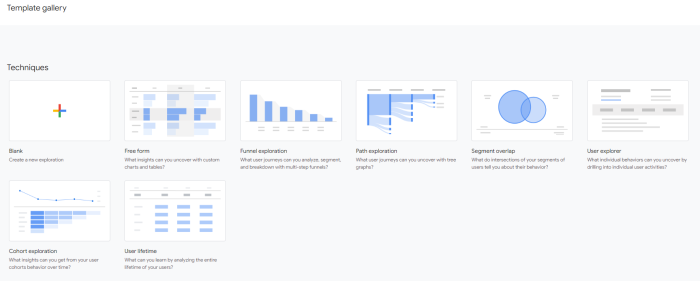
Source: Google
Your school can use these reports to segment website visitors or visualize the actions a prospect took to become an applicant. Depending on the template you choose, you can develop a data report on individual stages of the enrollment funnel or analyze the entire journey of an applicant.
If you want to get even more specific with your data, GA4 gives you the chance to create a fully customizable report. The image below is an example of a report built using the free-form template, a highly customizable technique. In this example, the report has been designed to monitor web traffic per country and per device.

Here, the majority of users are based in Canada and are active on three different devices: mobile, desktop, and tablet. This kind of data can help your school learn more about who its primary audience is and how they operate online.
But before choosing a template or building a report, it’s important to think about what you’re hoping to accomplish with your data. For example, you might be wondering which student persona is most responsible for your school’s website traffic. How well is a specific landing page converting visitors? Which prospects are engaging with your ads? With Google Analytics 4, your school can refine its search using filters and criteria that highlight the relevant data.
Create Conversions Tailored to Your School’s Needs in Google Analytics for Higher Education
A major change to expect with GA4 is that “Goals” are gone and replaced by “Conversions.” Conversions refer to interactions that you want prospects to go through on your website. In Universal Analytics, your school would have tracked conversions by manually setting goals.
In GA4, this process is simplified. Your school can select any events that contribute to its marketing goals and mark these events as conversions. Previously, not all goals would have registered interactions, like “student inquiries”. Now, your school can measure up to 30 web interactions as conversions. By tracking all the important activities, your school has a better idea of how well its marketing efforts are performing.
GA4 automatically tracks some events as conversions, including:
- page_view
- first_visit
- session_start
- scroll
When it comes to Google Analytics for education, there are a few events that you should make and mark as conversions using tracking codes. For example, “generate_lead” can be used to record when a prospect signs up for your school’s mailing list. Meanwhile, “application_view” can track when a prospect views the application form.
The image below shows some pre-defined and custom events that your school can use. Once the events have been created, you can easily track them as conversions with the “Mark as conversion” toggle on the right.

Once you have those conversions up and running, GA4 can compile a summary of your school’s most important data, including the most successful events. The example below is the homepage of GA4, which summarizes your school’s top events and conversions. Here, you will be able to see the most significant interactions that visitors are having with your school’s website.
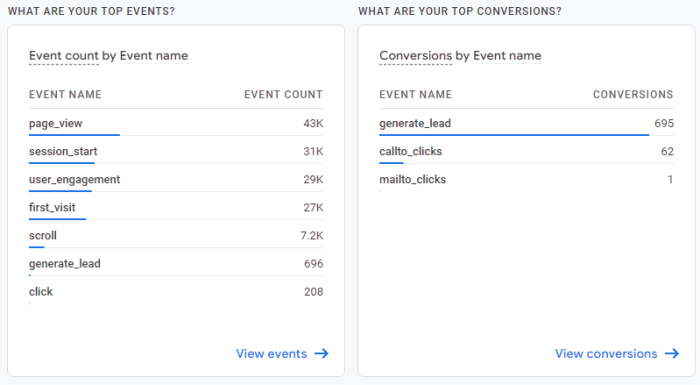
A tip from Alex is that “moving forward, it’ll be important to separate non-inquiry events (such as clicks to certain pages or time spent on a site) from events where the prospect does inquire (such as filling in a form or clicking a number to call admissions).” That way, your school can see where prospects are directing their attention, and which of its pages are most effective in generating action from potential students.
Evaluate the Efficiency of Your School’s Digital Channels
Around 80% of marketers report that high-quality data is essential for driving growth and customer experiences. That’s because marketers need reliable data to measure the value of their strategies, and the education sector is no different.
According to Alex, it is vital for schools to adopt GA4 as soon as possible, especially if they have lots of channels bringing in students. These may include ad campaigns, social media messaging, referrals from agencies, and more. GA4 will allow you to report on the efficiency of each and every one of these channels. At a highly precise level, you can see exactly which channels prospects are using to make inquiries and enroll in your school.
Collecting and interpreting data can feel overwhelming, but web analytics for higher education is essential to understand if you want to know how your school’s marketing efforts are performing. Many schools may also feel that they lack the tools or knowledge to unpack that data. Google Analytics 4 is here to bring convenience and flexibility to that process.
Most importantly, these updates represent a change in the way Google and marketers approach data collection. The focus is on empowering marketers to create advanced reports based on their needs. Now, every school can harness the power of data to make sophisticated marketing decisions at every stage of the student funnel.
Remember, GA4 is available now to migrate to. As we get closer to July 1, 2023 when Google Analytics (UA) will sunset and stop processing hits, there will only be a short window of time to access previous data. This is something you don’t want to delay. If you’re using UA, it’s essential that your data is migrated to GA4 as soon as possible to begin building new data sets in the platform. At that point, any historical data you have in UA won’t be imported to GA4. To get ready, you can set up a GA4 property now alongside your existing UA platform. That way, your school can familiarize itself with the new analytics tool and be ready to hit the ground running with a wealth of information.